


Dr. Wang Jun PW22-LASE Full Report | 6" Wafer High-Power Semiconductor Laser Chip Mass Production Line
03/31
2022
Jun Wang a,b *, Shaoyang Tan a , Heng Liu a , Bo Li a , Yiwen Hu a , Run Zhao a , Xiao Xiao a , Yang Cheng a , Yintao Guo a , Wu Zhao b , Lichen Zhang b , Pei Miao b , Lu ’an Guo a , Guoliang Deng b , Huomu Yang b , Hao Zhou b , Hong Zhang b , Xinsheng Liao a
a Suzhou Everbright Photonics Co., Ltd., Suzhou, P.R. China
b Sichuan University, Chengdu, P.R. China
Wang Jun a,b *, Tan Shaoyang a , Liu Heng a , Li Bo a , Hu Yiwen a , Zhao Run a , Xiao Xiao a , Cheng Yang a , Guo Yintao a , Zhao Wu b , Zhang Lichen b , Miao Pei b , Guo Luan a , Deng Guoliang b , Yang Huomu b , Zhou Hao b , Zhang Hong b , Liao Xinsheng a
a Suzhou Everbright Photonics Co., Ltd., Suzhou
b Sichuan University, Chengdu
Proceedings Volume 11983, High-Power Diode Laser Technology XX; 1198306 (2022) https://doi.org/10.1117/12.2610727
Event: SPIE LASE, 2022, San Francisco, California, United States
Abstract
High-power semiconductor lasers are widely used as pump sources for fiber lasers and solid-state lasers, or as light sources for direct semiconductor laser systems. To meet the emerging demands of fiber lasers, solid-state lasers, and direct semiconductor laser systems, semiconductor lasers are developing towards larger manufacturing scales, higher performance, and lower costs. In this paper, we introduce our progress in these areas. We have established a 6" gallium arsenide wafer production line for high-power semiconductor laser chips, including MOCVD epitaxial growth and wafer fabrication. With the 6" wafer production line, we produce millions of chips monthly for fiber laser pumping. The 6" wafers demonstrate excellent uniformity and repeatability. Device performance is outstanding, with efficiency close to 70%, high DC saturation power, and stable long-term lifetime.
Keywords: High power, laser diode, mass production, 6" wafer, GaAs wafer fabrication
01 Introduction
High-power semiconductor lasers are widely used as pump sources for fiber lasers and solid-state lasers, or as light sources for direct semiconductor laser systems [1-5] To meet the emerging demands of fiber lasers, solid-state lasers, and direct semiconductor laser systems, semiconductor lasers are developing towards larger manufacturing scales, higher performance, and lower costs. The main effort to increase manufacturing scale is to use larger substrates and adopt automated production. Over the past two decades, the size of gallium arsenide substrates used for high-power semiconductor laser chip products has increased from 2" to 6". Although using 6" wafers can significantly increase the number of chips per wafer, uniformity and repeatability become more critical for mass production.
In this paper, we introduce the latest progress of Suzhou Everbright Photonics Co., Ltd. (hereinafter referred to as "Everbright") 6" wafer production line. This production line produces millions of chips monthly for fiber laser pumping. The paper details the uniformity and repeatability of epitaxy and manufacturing of 6" wafers. It also introduces the performance of high-power laser devices.
02 MOCVD Epitaxial Growth
Everbright has established an integrated production line for 6" gallium arsenide wafers, integrating MOCVD epitaxial growth, wafer fabrication, device assembly, and testing aging. The epitaxy part uses a multi-chamber Aixtron 2800 G4 reactor. The reactor design features high uniformity and high throughput, as well as good uptime. The reactor can grow 8 6" wafers per run. To improve material uniformity and repeatability, Everbright further developed the epitaxial growth process based on the baseline process recommended by the manufacturer [6,7]. We studied various factors affecting growth rate uniformity through simulation and experiments. Simulation modeling was performed using CVD Sim software [6]. The model includes gas phase and surface chemical reaction kinetics, gas transport dynamics, and thermodynamics. Figure 1(a) shows the modeling of a planetary 8x6" MOCVD reactor. Figure 1(b) shows example modeling results of MMAl distribution on 6" substrates under two different AsH injection configurations. 3 Modeling example of MMAl distribution on 6" substrates under two different AsH injection configurations.
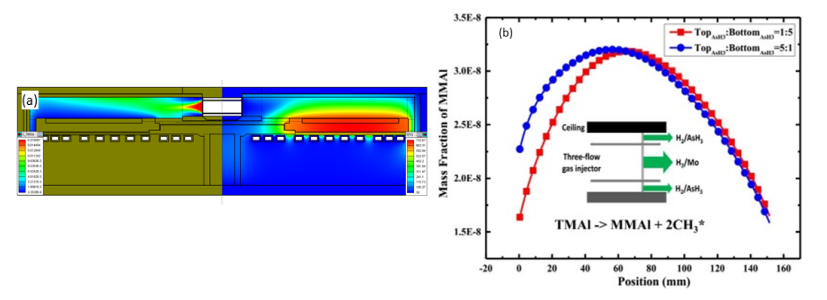
Figure 1 Modeling of the planetary 8x6" MOCVD reactor. (a) Two-dimensional images of gas concentration and temperature in the reactor. (b) Example of modeling results of MMAl distribution on a 6" substrate under two different AsH3 injection configurations.
Wafer curvature and surface temperature are key factors affecting the growth rate. These parameters are monitored online. Figure 2(a) shows the curvature distribution of 8 wafers during the growth of the 9xx nm structure. As shown, the curvature of each wafer remains at 20 km. -1 Below, the difference between wafers is less than ±30%. Figure 2(b) shows the temperature distribution of each wafer during the same growth process. The temperature of each wafer is higher at the center and lower at the edges. The average temperature variation of each wafer is less than 2°C. Figure 3 is the photoluminescence spectrum (PL) of the 9xx LD epitaxial wafer. The standard deviation of the PL wavelength across the entire 6" wafer is only 0.56 nm.
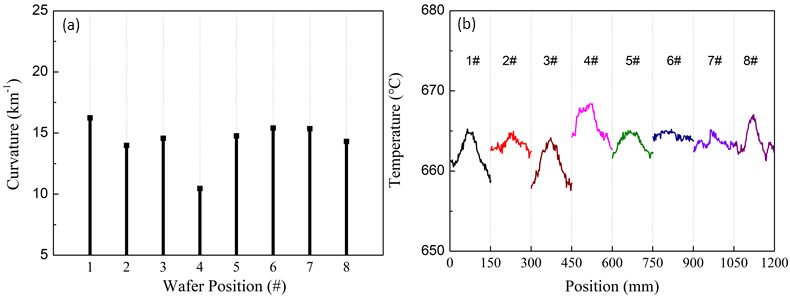
Figure 2 Process monitoring of MOCVD growth parameters. (a) Curvature of 8 wafers grown in the same batch. (b) Temperature distribution of wafers during the growth of the 9xx nm epitaxial structure.
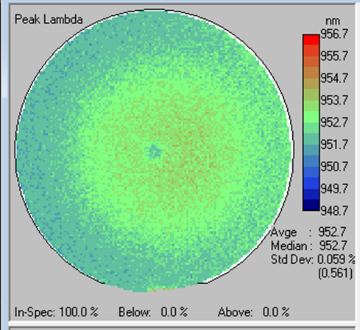
Figure 3 Distribution of PL peak wavelengths of 9xx nm epitaxial wafers.
Another important parameter of epitaxial growth is material composition. We examined the composition of 9xx LD epitaxial wafers using high-resolution XRD. Three test points were measured along the radial direction at coordinates (0,0), (65,0), and (70,0) mm. The results show that the absolute Al content deviates less than 1% from the 60% target. After applying statistical process control, the Al content in the AlGaAs cladding is controlled within ±2%, as shown in Figure 4.
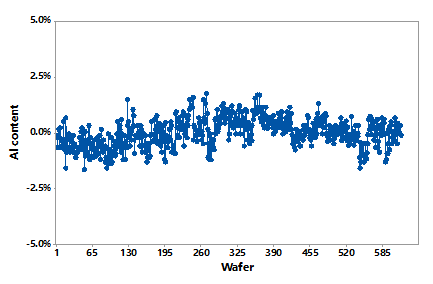
Figure 4 Variation of Al component in the AlGaAs epitaxial cladding of wafers over 6 months. Each data point represents one growth batch.
To achieve high operating power and electro-optical conversion efficiency, we finely designed the doping level, material composition, and thickness of the epitaxial layer structure. The doping distribution curve is important, especially for the P-side waveguide and cladding. Figure 5 shows the relative carrier concentration in the AlGaAs cladding of 9xx nm wafers measured by ECV (electrochemical capacitance-voltage). We measured four positions from the wafer center to a radial distance of 65 mm. Carrier concentration is normalized to the value at the wafer center. The variation in carrier concentration among the four test points is only 15%.
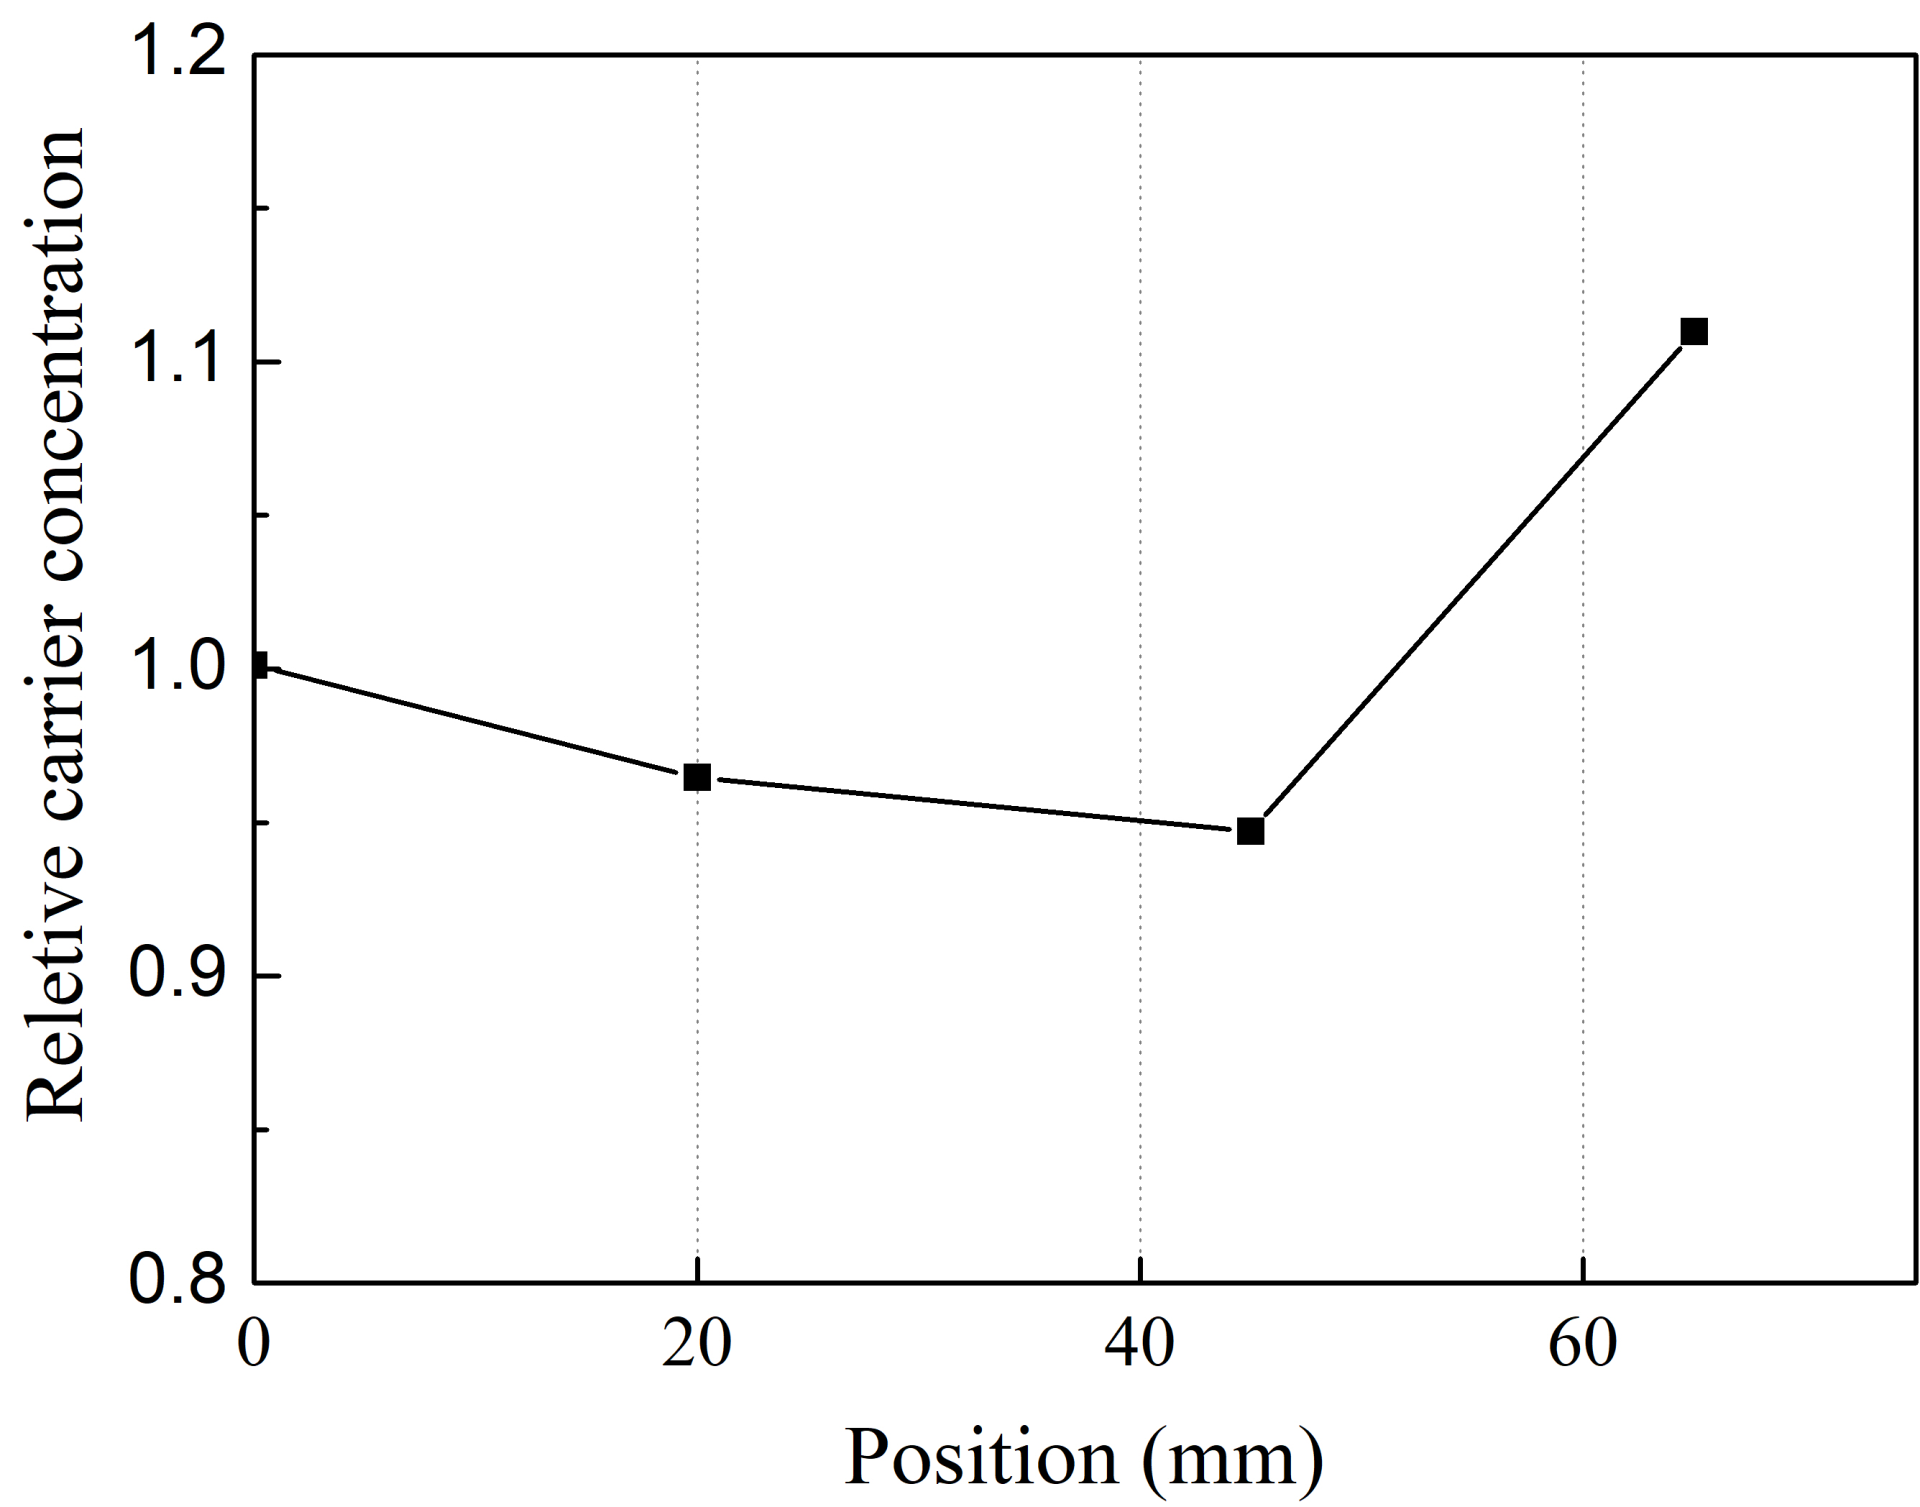
Figure 5 Relative carrier concentration along the radial direction in the P-AlGaAs cladding.
Defects in the epitaxial layer are the main cause of catastrophic optical damage (COD) failure mode in devices. Therefore, defect control during epitaxial growth is very important. Through proper maintenance of accessories and chamber adjustments, defects are well controlled. Figure 6(a) shows the typical defect distribution among 6" wafers, with defect sizes ranging from 0.1 to 20 μm and a total defect density of 0.475 cm. -2 Figure 6(b) is the trend chart of defect density variation of 650 wafers grown over a certain period. The average surface defect density of these wafers is 0.77 cm. -2 Surface defect density exceeding 3.0 cm. -2 The percentage of epitaxial wafers exceeding the control limit is only 2.1%.
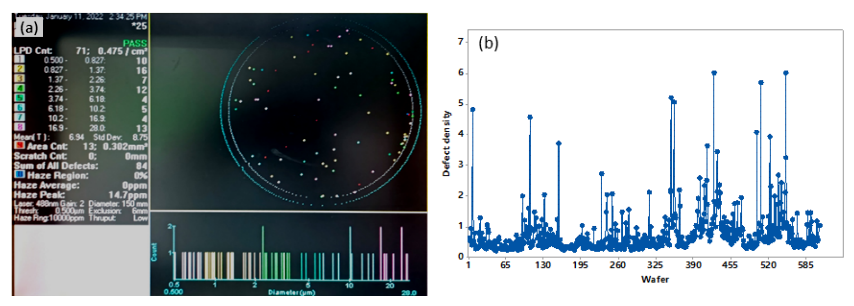
Figure 6 Epitaxial defect density of wafers. (a) Defect distribution on the surface of 9xx LD epitaxial wafers. (b) Statistical process control of average surface defect density versus number of wafers grown. One data point represents one growth batch.
03 Wafer Fabrication
Most of our 6" wafer fabrication processes are equipped with automation systems to improve yield and good die rate. The photolithography process introduced high-precision stepper lithography machines and automatic spin-coating and developing trackers. The etching process introduced dry-in/dry-out wafer cleaning machines and wet etching machines to achieve precise etching control and reduce liquid and particle contamination. Metal film deposition uses electron beam evaporation and sputtering. Dielectric films are deposited by PECVD. Grinding, polishing, and annealing are completed using semi-automatic equipment. After wafer fabrication, all wafers undergo automatic optical inspection to track and classify defects on each chip. Thanks to these automated devices, our wafer fab produces over one hundred 6" wafers daily.
Key processes in wafer fabrication include photolithography, mesa etching, dielectric film deposition, and metallization. Among these, mesa etching is the most critical, as the etching depth determines the near-field and far-field spot distribution in the slow axis direction, ultimately affecting fiber coupling efficiency in fiber modules. Figure 7(a) shows the in-wafer etching depth distribution of 6" wafers, measured 9 times along the diameter. Data show that etching depth variation is within ±0.5%. Meanwhile, the average etching depth variation between wafers is less than 3%, as shown in Figure 7(b).
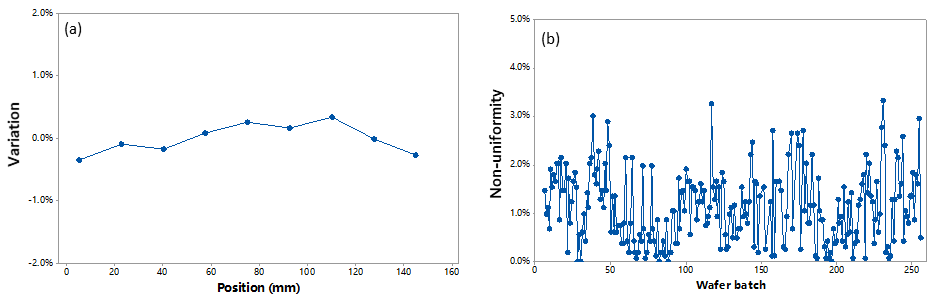
Figure 7 Variation of mesa etching depth. (a) Variation of mesa etching depth within a 6" wafer. (b) Comparison between wafers, each data point represents the relative range of wafer mesa depth.
For dielectric film deposition, we mainly focus on thickness, refractive index, and stress between the film and substrate. We studied gas flow ratios, temperature, and pressure in the PECVD reactor to improve uniformity. Figure 8(a) shows that the range of thickness non-uniformity of dielectric films on 6" wafers is less than 5%. The refractive index is controlled within 1.47±0.01. Meanwhile, film stress is controlled within ±10% of the target. Figure 8(b) shows the thickness non-uniformity of dielectric films over a certain period, with non-uniformity less than 5%.
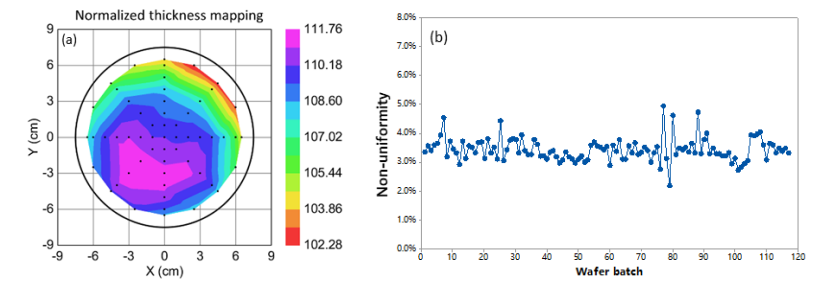
Figure 8 Characteristics of dielectric films. (a) Normalized thickness of silicon oxide within 6" wafers. (b) Thickness non-uniformity of silicon oxide over a certain period, with each data point representing one wafer batch.
P Metal films on the P side are deposited using automatic sputtering equipment. We optimized process parameters including plasma power and the distance between the target and plasma source to improve thickness uniformity of the target. Under optimized conditions, the thickness non-uniformity within 6" wafers produced over 6 months is less than 3.5%, with an average of 0.9%, as shown in Figure 9.
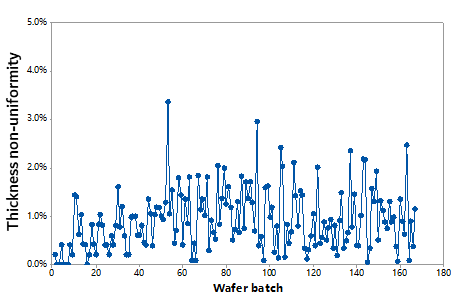
Figure 9 Thickness non-uniformity of metal films over a certain period, with each data point representing one wafer batch.
Wafer grinding and polishing are highly challenging for 6" wafer processing because larger wafer sizes lead to higher wafer breakage rates. We bond the wafers to carriers using semi-automatic wafer bonding/debonding and automatic grinding/polishing equipment to address this issue. For different device product designs, wafer thickness control from 100μm to 150μm can be achieved. Figure 10 shows that the thickness variation between wafer batches is within 15μm.
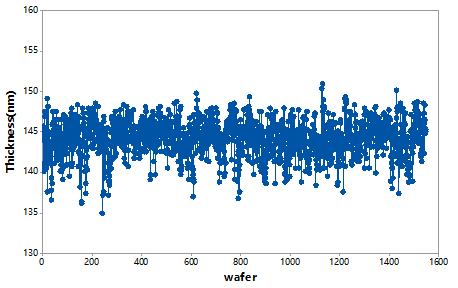
Figure 10 Wafer thickness after grinding and polishing over a certain period, where each data point represents the average thickness of one wafer.
After the wafer manufacturing process, wafers are cleaved into bars/single emitter chips, then undergo special cavity surface passivation treatment, and low/high reflectivity films are deposited on the front/back cavity surfaces respectively. The coating process uses automatic bar arrangement, automatic optical inspection, and automatic chip sorting to improve yield. Currently, the monthly output of edge emitter single emitter chips exceeds several million and continues to increase.
04 Device Optoelectronic Performance and Long-Term Lifetime
According to chip size, power, and application requirements, we assemble high-power laser single emitter chips or bar chip sets onto appropriate heat sinks. Bare die mounting, wire bonding, inspection, and testing are all performed using automated systems, most of which are independently developed.
4.1 Device Optoelectronic Performance
Changguang Semiconductor's semiconductor laser chip products include bars and single emitter chips with wavelengths ranging from 750nm to 1060nm. Here, we present key performance data of some typical products.
808 nm Laser bars are the most widely used products in solid-state laser pumping. The batch-produced bar cavity length is 1.5mm with a fill factor of 80%. Laser bars are bonded to microchannel coolers (MCC) and tested under quasi-CW conditions with a pulse width of 200μs, repetition frequency of 400Hz, and cooling water temperature of 25°C. The relationship between optical power and electro-optical conversion efficiency versus operating current is shown in Figure 11. At 450A, the optical power exceeds 560W, and the peak electro-optical conversion efficiency reaches 67%. Under 500W operating conditions, the electro-optical conversion efficiency is above 60%. These devices operate in TE polarization mode. This data is the highest known to us currently.
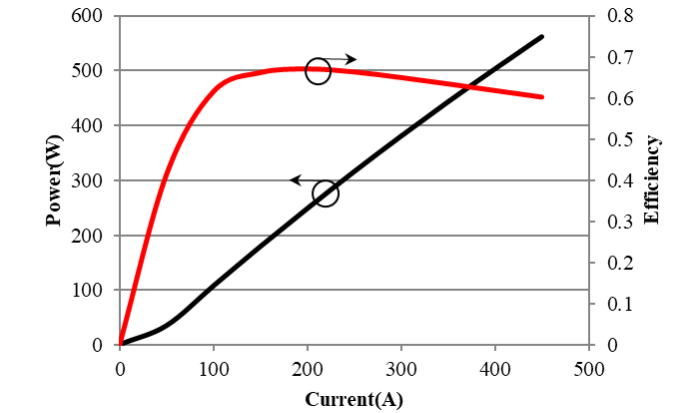
Figure 11 Optical power and efficiency curves of 808nm bar chips.
885-980nm Laser single emitter chips within the wavelength range are widely used for pumping high-brightness solid-state and fiber lasers. This type of chip uses AlGaAs as the waveguide layer and AlGaInAs as the quantum well. We fine-tune the doping level and waveguide composition of the epitaxial structure to comprehensively reduce internal optical loss and series resistance. [8 ,9] Additionally, this structure adopts an asymmetric waveguide design to increase the optical spot size and reduce the small-plane optical load density.
One typical chip has an emission stripe width of 230μm and a cavity length of 4.5mm, with optical power up to 30W. Figure 12(a) shows the CW optical power and electro-optical conversion efficiency of 885nm, 915nm, and 980nm chips at a heatsink temperature of 25°C. For all these chips, the optical power is above 30W, and the electro-optical conversion efficiency is higher than 65%. These devices have undergone high current testing at 60A without COD occurring before power thermal rollover. The maximum power at rollover can reach 45W, as shown in Figure 12(b). High rollover power and current indicate the chip has high device quality.
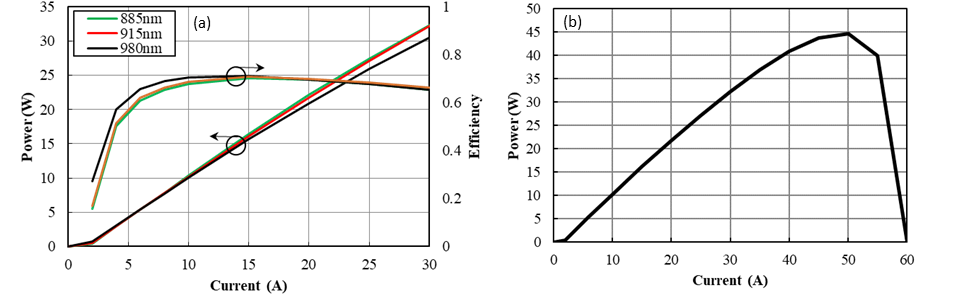
Figure 12 Optical power and electro-optical conversion efficiency of laser single emitter chips in the 885-980nm wavelength range. (a) Optical power and electro-optical conversion efficiency of 885nm, 915nm, and 980nm laser single emitter chips. (b) High current testing of the 915nm laser.
The device optoelectronic performance of laser chips on the wafer is very uniform. Figure 13(a) shows the wavelength peak distribution of 980nm 30W laser chips from a 6" wafer. There is no significant variation along the radial direction. The standard deviation of wavelength deviation on the wafer is about 0.5nm. Figures 13(b) and 13(c) show the optical power and electro-optical conversion efficiency of chips from the same wafer, with variations within the wafer less than 2%. These results again demonstrate the high uniformity of the MOCVD wafer manufacturing process.
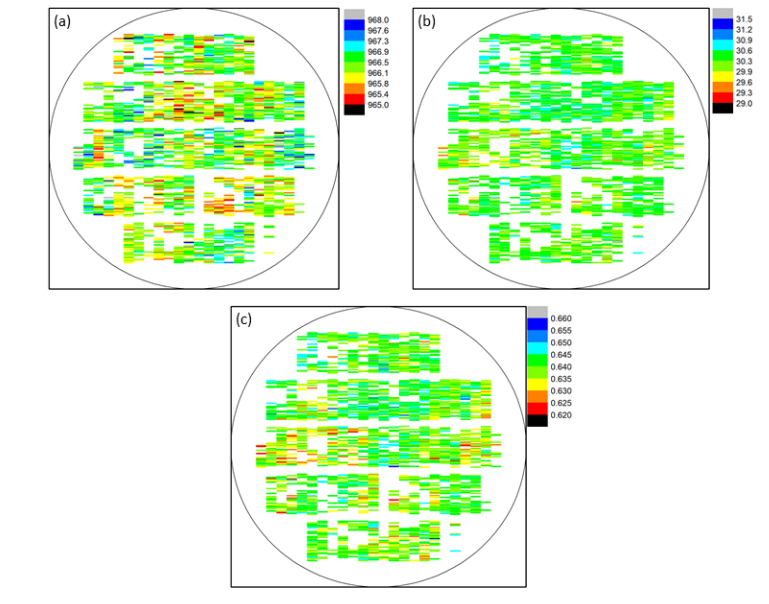
Figure 13 Performance data distribution of chips from a 6" 980nm wafer, tested at 25°C. (a) Wavelength, (b) Optical power, (c) Electro-optical conversion efficiency.
Wafer chips have good repeatability over a long period. Figure 14 plots the average output power of all chips on 860 consecutive 6" wafers. For this 860 wafer, the optical power variation standard deviation is about 1.5%. This excellent long-term power repeatability represents good control over epitaxy, wafer manufacturing, and cavity surface coating.
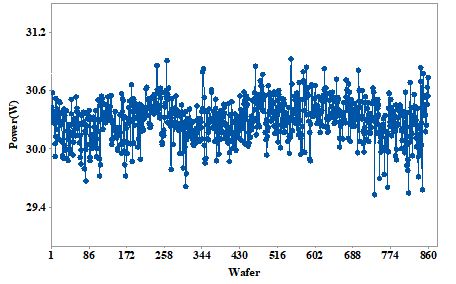
Figure 14 Trend of average output power of all chips on 6" wafers, where each data point represents the average output power of a wafer.
Our 6" MOCVD epitaxy and wafer manufacturing production line can produce not only high-power edge-emitting laser chips but also covers VCSEL (Vertical-Cavity Surface-Emitting Laser) manufacturing. We produce VCSEL arrays mainly for LiDAR and 3D sensing applications. The VCSEL epitaxial structure contains hundreds of layers, and its performance is very sensitive to the thickness, doping, and interface quality of each layer. Each array usually consists of hundreds of emitters. Their mesa etching, dielectric film, and metallization processes have a more direct impact on device performance than edge-emitting processes. Figure 15 shows the wavelength mapping and electro-optical conversion efficiency of arrays from a 940nm VCSEL wafer. The optical power of each array is 3W. The standard deviation of wavelength deviation on the wafer is 0.9nm, and the non-uniformity of electro-optical conversion efficiency is about 2.5%. These data further prove the high uniformity of our 6" wafer manufacturing.
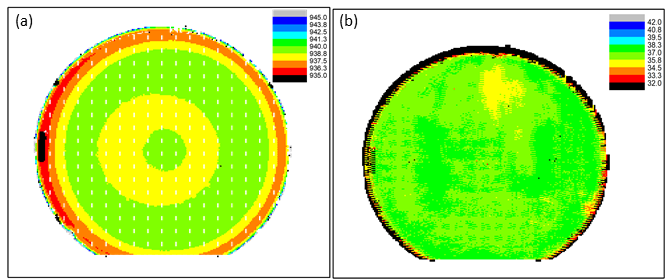
Figure 15 Laser peak wavelength and electro-optical conversion efficiency mapping of 940nm 3W VCSEL chips from a 6" wafer.
4.2 Long-Term Lifetime
To evaluate the long-term reliability of laser chips, we conducted accelerated lifetime tests. Figure 16 shows a set of accelerated lifetime test data, with normalized power P/P 0 Relationship graph with lifetime test time. This group contains 24 chips, which were randomly sampled from the mass production line. The drive current is fixed at 28A, the optical power at room temperature is 30W, and the junction temperature rises to 90°C. Optical power was measured and recorded during the lifetime experiment. The lifetime cycle has accumulated over 6500 hours and is still ongoing. From the data, it can be seen that none of the devices experienced sudden failure or significant power degradation. Based on an activation energy of 0.45eV [4 ,5,10] acceleration model, we calculated an acceleration factor of 5.5. Under 30W and room temperature operating conditions, the chip's equivalent lifetime exceeds 36,000 hours.
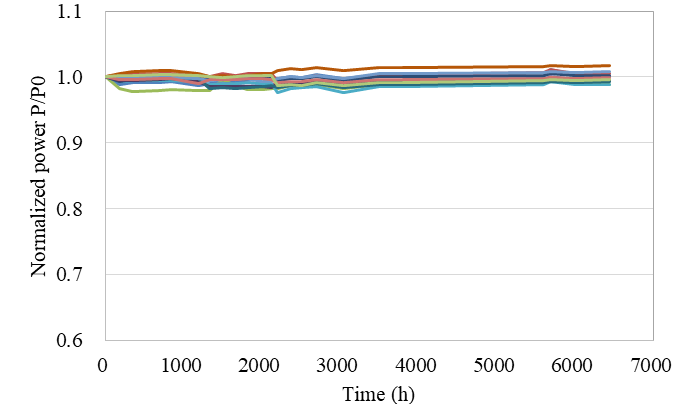
Figure 16 Accelerated lifetime data at 28A drive current and 90°C junction temperature.
05 Summary
We have established a high-quality and high-yield 6" high-power laser chip production line. Key parameters in MOCVD epitaxy and wafer manufacturing are reported, demonstrating high uniformity and repeatability. This production line can produce millions of edge-emitting high-power laser chips per month. The optical power of 808nm laser bars exceeds 500W, the rated optical power of 88x-9xxnm single laser chips exceeds 30W, peak efficiency exceeds 70%, and CW rollover power reaches up to 45W. In addition, high-power single laser chips have undergone accelerated lifetime testing, showing good long-term reliability.
References
[1] Kanskar, M., Bao, L., Chen, Z., Hemenway, M., Dawson, D., DeVito, M., Dong, W., Grimshaw, M., Guan, X., Kennedy, K., et al., "High-brightness diodes and fiber-coupled modules," Proc. SPIE 9348, 934804 (2015).
[2] Yu, H., Tan, S., Pan, H., Sun, S., Li, J., and Wang, J., "Development of a 350 W, 50 μm, 0.15 NA wavelength stabilized fiber coupled laser diode module for pumping Yb-doped fiber laser," Proc. SPIE 11262, 112620V (2020).
[3] Yu, H., Tan, S., Pan, H., Sun, S., Yu, T., Li, J., and Wang, J., "High efficiency 600 W, 100 μm wavelength stabilized fiber coupled laser diode module for fiber laser pumping," Proc. SPIE 11668, 116680E (2021).
[4] Bao, L., Wang, J., Devito, M., Xu, D., Wise, D., Leisher, P., Grimshaw, M., Dong, W., Zhang, S., Price, K., Li, D., Bai, C., Patterson, S., and Martinsen, R., "Reliability of high performance 9xx-nm single emitter diode lasers," Proc. SPIE 7583 (02 2010).
[5] Wang, J., Bao, L., Devito, M., Xu, D., Wise, D., Grimshaw, M., Dong, W., Zhang, S., Bai, C., Leisher, P., Li, D., Zhou, H., Patterson, S., Martinsen, R., and Haden, J., "Reliability and performance of 808nm single emitter multi-mode laser diodes," Proc. SPIE 7583 (02 2010).
[6] Gou Y., Wang J., Cheng Y., Guo Y., Xiao X., Zhou S., "A Modeling and Experimental Study on the Growth of VCSEL Materials Using an 8 × 6 Inch Planetary MOCVD Reactor", Coatings, 10(8), 797 (2020).
[7] Gou Y., Wang J., Cheng Y., Guo Y., Xiao X., Liu H., Tan S., Zhou L., Yang H., Deng G., Zhou S., "Experimental and Modeling Study on the High-Performance p++-GaAs/n++-GaAs Tunnel Junctions with Silicon and Tellurium Co-Doped InGaAs Quantum Well Inserted". Crystals, 10(12), 1092 (2020).
[8] Dan J., Tan S., Wang B., Xiao Y., Deng G., Wang J., "Effect of waveguide structure on beam quality and power of 905nm cascade lasers with tunnel junctions", Infrared and Laser Engineering, accepted.
[9] Wang B., Tan S., Zhou L., Zhang Z., Xiao Y., Liu W., Gou Y., Deng G., Wang J., "Highly reliable 808nm laser diode with output power over 19W", IEEE Photon. Technol. Lett., accepted.
[10] International Organization for Standardization. (2003) Optics and optical instruments - Lasers and laser-related equipment - Lifetime of lasers (ISO 17526:2003).
Recommended Reading

Address: No.56,Lijiang Road,SND,Suzhou,Jiangsu Province,P.R.China
Mailbox:sales@everbrightphotonics.com
Website:www.everbrightphotonics.com
Phone:+86 0512-66896988
Fax:+86 0512-66806323
Message Board